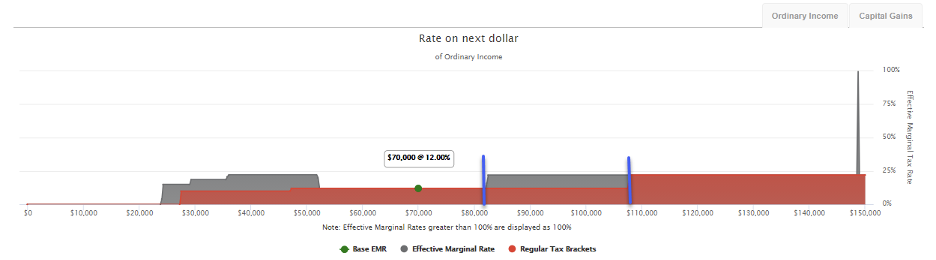
The taxation of Social Security is illustrated in gray as an increase in the overall effective marginal tax rate.
Demonstrating Taxable Social Security in Tax Clarity
Use the provisional income formula to determine how much of a worker's Social Security benefit will become taxable.
Provisional income includes:
- Taxable wages
- Nontaxable interest
- Dividends
- Pensions
- Self-employment
- And other taxable income, plus half of the worker's Social Security benefit.
Tax Clarity illustrates the taxation of Social Security as an increase in the overall effective marginal rate (gray)—typically starting just before the 10% tax bracket and ending when 85% of all benefits are taxed. After Social Security benefits are taxed, the software pulls each bracket forward to represent the additional taxable income generated. In this typical example, the taxable income increases by the amount represented by 85% of Social Security benefits, bringing the worker closer to the next tax bracket threshold.
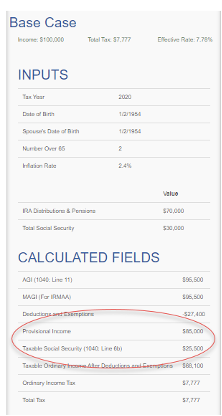
For example, a married couple both born on 1-2-1954 have $70,000 in IRA distributions and $30,000 of Social Security benefits. In 2020, their provisional income included $15,000 of Social Security and $70,000 of their IRA distribution for a total of $85,000 in provisional income. This situation causes 85% of the workers' Social Security benefits, $25,500, to be taxable.
In Tax Clarity, you can find these values below the Tax Map by selecting ‘Details’ and looking under calculated fields.
For every additional dollar starting at approximately $23,750, the provisional income formula drags in 85 cents of Social Security to become taxed. This situation is illustrated by the first gray bar in the below graphic. The effective marginal rate increases above the normal tax brackets from $23,750 to $52,250. At this point, 85% of Social Security benefits are being taxed.
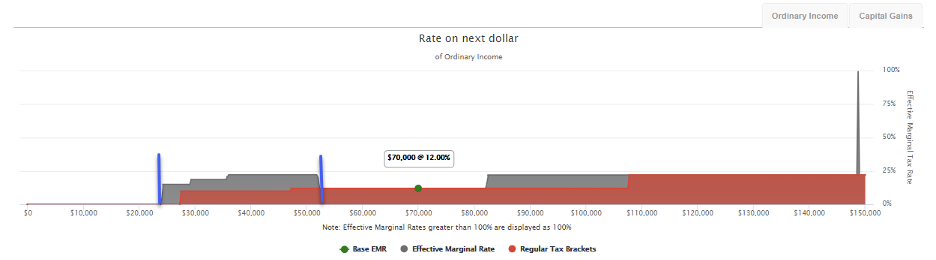
Social Security also impacts the Tax Map by pulling subsequent tax brackets forward by 85% of Social Security benefits or taxable Social Security. Social Security is not represented as taxable income on the x-axis. After Social Security has been taxed, the workers' taxable ordinary income after deductions and exemptions are greater than what is represented on the x-axis, illustrated below by the second gray bar in the graphic.