Income InSight provides a direct "line of sight" into the Account Balances, the Income by Result, the Income by Source and the Tax Map graphs.
To begin, each quadrant of the results dashboard answers one of four fundamental retirement income plan questions:
- Account Balances: How long will my money last?
- Income by Result: How much can be spent net of taxes?
- Income by Source: Which accounts should be drawn from and when?
- Tap Map: What does the tax picture look like?
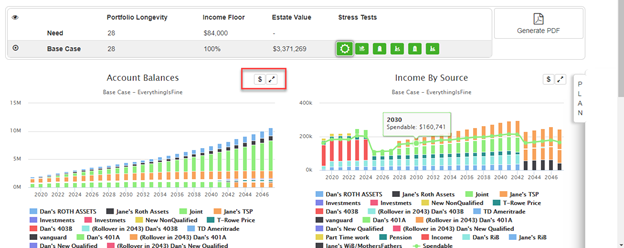
Additional detail can be found on each graph with the expansion tabs outlined in red in the screen pictured below:
- Chart Expansion: Select the "<>" in the upper right corner of the respective graph to get a full-page expansion of the chart.
- Note also that once a Chart is expanded, Income InSight functionality allows for a component to be removed, or hidden, from the graph by clicking on the respective color coded tab in the legend key at the bottom.
- View Cashflows: Select the "$" in the upper right corner for a tabular view of the cash flows associated with the graph.