Reading the Break-Even Chart
The break-even calculator in Social Security Timing shows the exact age at which your clients' can expect a decision to delay Social Security to pay off.
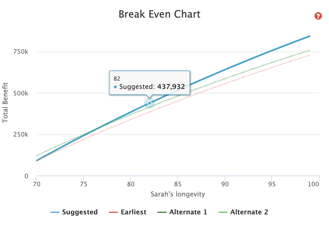
When generating a report for a single person, Social Security Timing displays one line for electing benefits early and one line for electing benefits later. At some point, those lines cross. That’s the break-even point. If your client's estimated life expectancy is beyond that break-even point, conventional wisdom says you should delay benefits.
The Break-Even Chart for Married Couples
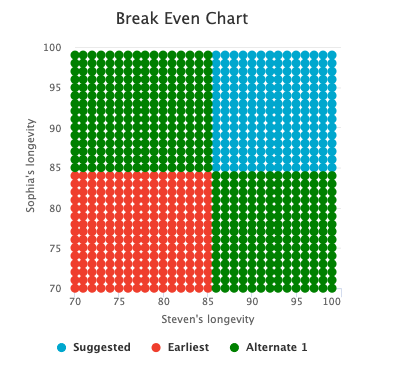 For couples, the Social Security Timing break-even chart takes this idea a step further. It shows the amount that would be received under each strategy at each possible death age between 70 and 100.
A few things to note:
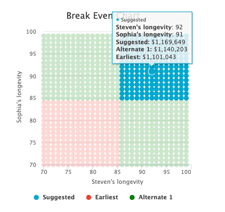
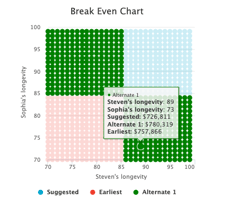
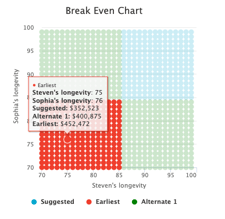
- The longevity for spouse 1 (Steven in our example) is represented on the x-axis.
- The longevity for spouse 2 (Sophia in our example) is represented on the y-axis.
- The suggested strategy is represented in blue.
- The earliest Social Security claiming option is represented on the chart in red.
- Alternate 1, in green, is the widest split between the two different Social Security benefits. (This is one of the most common claiming strategies for couples.)
Note: For married couples, the break-even point all depends on who lives to what age. Each dot on the chart represents a different life expectancy combination. Everywhere you see two different colors bump up against each other are all potential break-even points.
If you hover over the chart with your cursor, you'll see a box that shows how much your clients would receive under each strategy at each possible death age.