SmartRisk represents a significant advancement in the field of portfolio risk measurement, employing a 99.5% expected tail loss (ETL) within its proprietary heavy-tail model. This method concentrates on evaluating the average of the portfolio's worst 0.5% returns, providing a more detailed analysis of potential risks. Traditionally, risk calculations relied on Gaussian models, known for their bell curve or normal distribution. These models were prevalent from the late 1950s through the early 2000s, largely due to their simplicity and minimal computational requirements. However, the evolution of affordable and powerful computing technologies has enabled a shift towards more sophisticated heavy-tail models. These models are adept at capturing a broader range of extreme market events, which occur more frequently than Gaussian models would suggest.
In terms of its analysis methodology, SmartRisk does not rely on benchmark or asset class information. Instead, it evaluates risk based on the actual performance characteristics of individual holdings, using ticker symbol information. This approach allows for a more precise estimation of portfolio risk. In scenarios where advisors might find this method inadequate, such as with a mutual fund having a very short trading history, SmartRisk provides flexibility. Advisors can substitute such holdings with others that have similar risk characteristics by employing 'Smart Symbols'. Smart symbols can also be used for unrecognized symbols or non-traded assets.
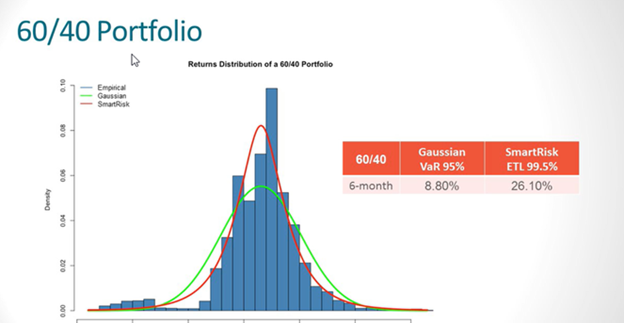
A key aspect of understanding SmartRisk involves recognizing the difference between heavy-tailed and Gaussian distribution models. Heavy-tailed distributions are characterized by tails that are not exponentially bounded, approaching zero at a slower rate, and potentially including outliers with very high values. This means they are more likely to account for large, unforeseen market events. In contrast, Gaussian distributions, or bell curves, assume a more symmetric distribution of data, with fewer extreme values. Graphically, the heavy-tailed model used by SmartRisk is shown to capture more risk compared to the Gaussian model, particularly evident in a model 60/40 Portfolio analysis.
The adoption of heavy-tail models, such as SmartRisk, has significant implications for both advisors and clients. These models offer a more accurate representation of risk, particularly in extreme market conditions, thereby helping clients manage emotional reactions and make better investment decisions. More detailed insights into this transition and the benefits of heavy-tail models over traditional approaches can be found in the white paper titled "The Risk Evolution."