Generating a client-friendly report in Income InSight, Tax Clarity, Social Security Timing, or SmartRisk is a quick and straightforward process. Follow the steps below or watch this video.
Jump to:
How do I run a client report from Income InSight?
Tip: Utilize the intake form for quick and efficient data entry.
To run a client report from Income InSight:
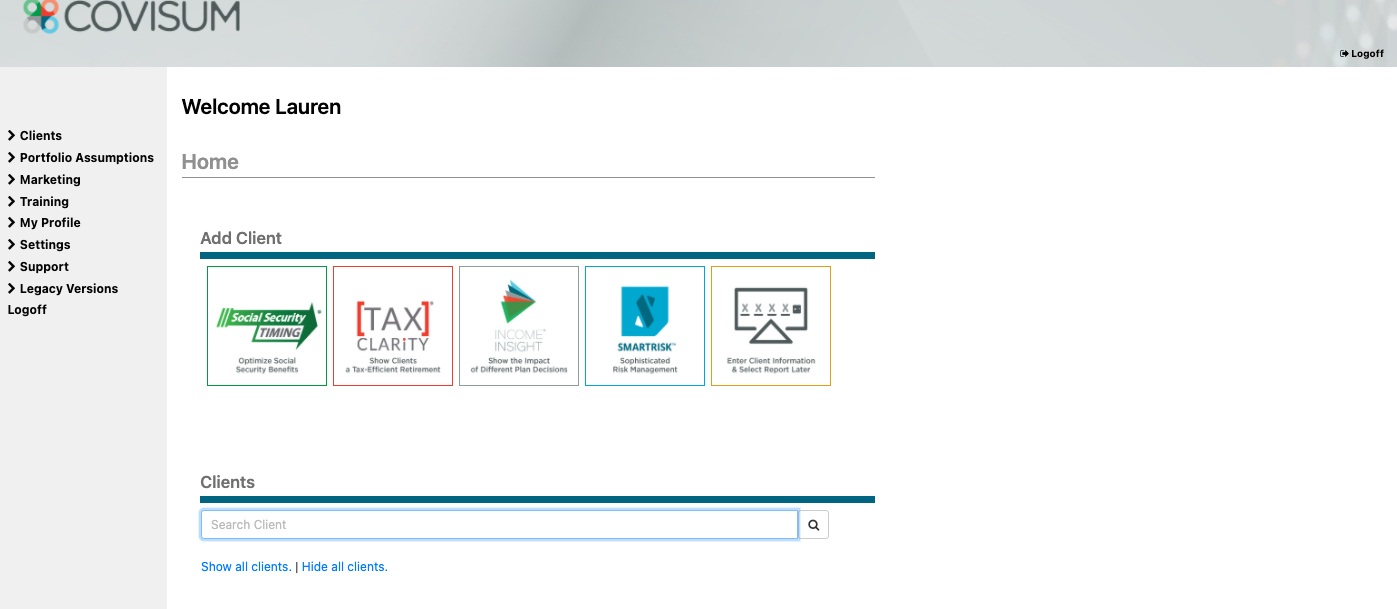
- Log in and select "Add Client."
- Select "Import" or "Manual Entry."
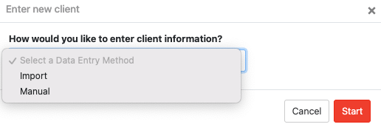
- Click "Start" to proceed.
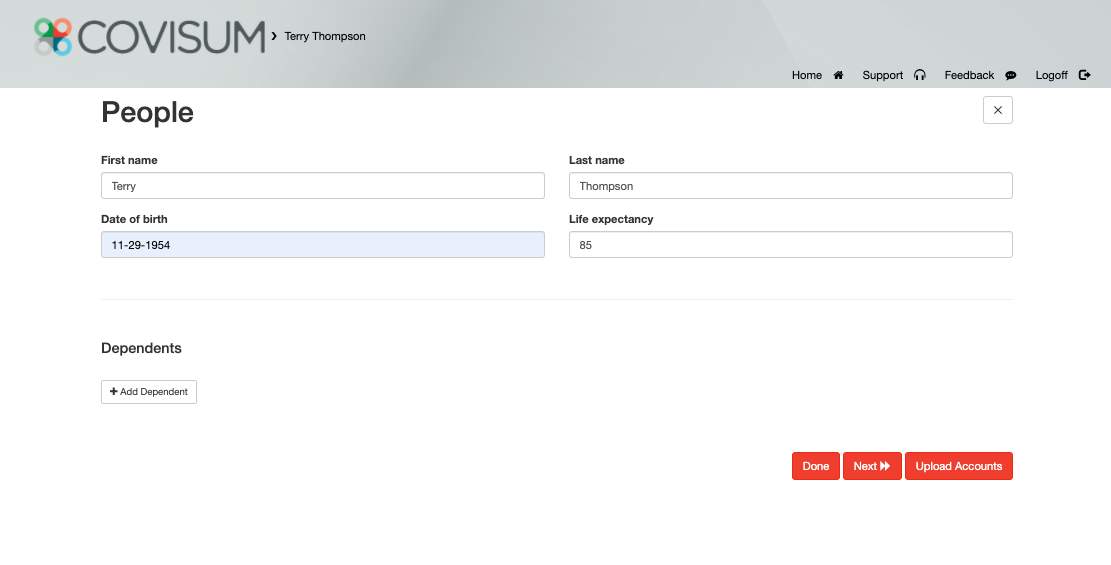
- Enter the client's date of birth (DOB) and life expectancy.
- Complete all necessary client information. A red halo indicates incomplete information.
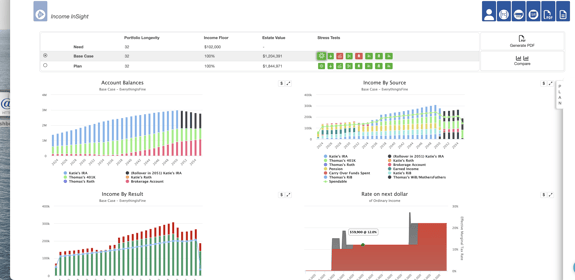
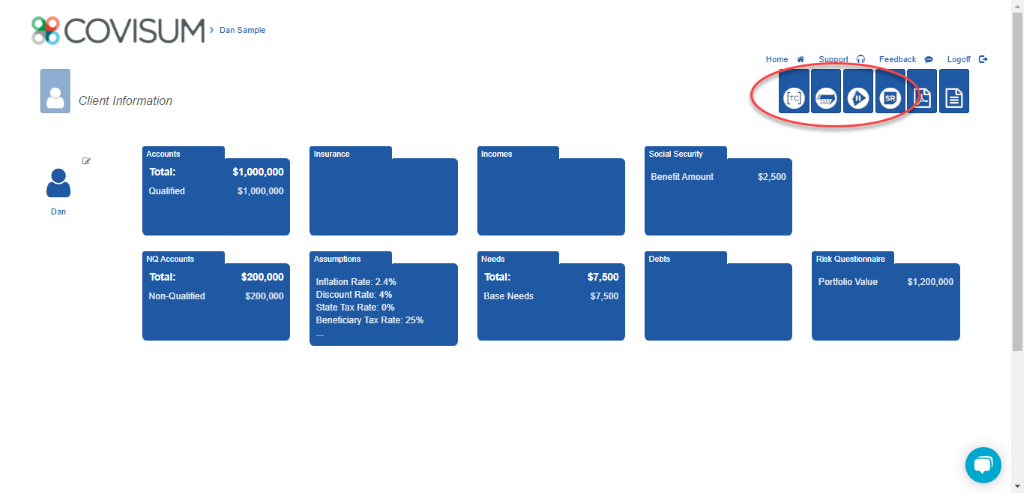
- Click the Income InSight tab in the upper right-hand corner.
- The financial analysis consists of four charts, namely:
- Account Balances
- Income by Source
- Income by Result
- Rate on Next Dollar
- Above the graphs, find the Impact Estimate Dashboard showcasing your client's Portfolio Longevity, Income Floor, and Estate Value.
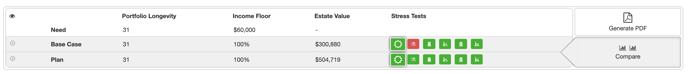
- Review the "Stress Test" tabs. Each tab represents a different scenario. When a tab is selected, Income InSight will run an analysis with the assumptions listed. A green stress test indicates your client's income levels will last as planned. A red stress test indicates the desired income levels will not last given the selected scenario. Stress tests include:
- Everything is Fine
- Down Market
- High Inflation
- Social Security Benefit Cuts
- Client/Spouse Dies Early
- Long-Term Care is Required for Client/Spouse
- Utilize the "Plan" tab to adjust your client plan variables and develop an income plan. Plan variables include:
- Add a Single Preferred Immediate Annuity (SPIA)
- Add Term Life Insurance
- Add Permanent Life Insurance
- Add Long-Term Care
- Add Deferred Annuity
- Change Harvesting Pattern/Withdrawal Strategy
- Change Social Security Strategy
- Refine Health Insurance
- Refine Spending
- Reallocate Portfolios
- When additional assumptions or data are required, a red halo will outline that required field.
- Click the "$" tab for a tabular view of input and assumptions.
- The diagonal arrows tab enlarges the graph.
Tip: To print your report, select "Generate PDF" and click the printer icon at the top of the screen.
If you have any questions, please contact our customer experience team.
How do I run a client report from Tax Clarity?
Tip: Use the Tax Clarity intake form to make data entry a breeze.
To generate a client report from Tax Clarity:
- Log in and select "Add Client."
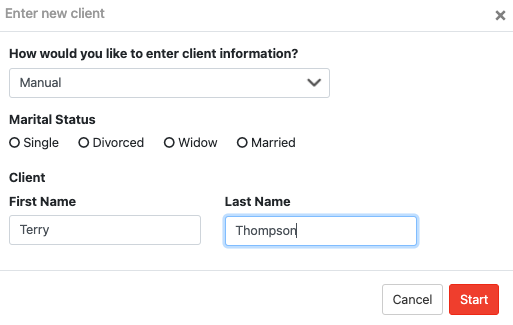
- Select "Import" or "Manual Entry."
- If you selected "Manual Entry," enter the client information, including filing status, first name, last name, and DOB.
- In "Settings," choose the tax year and apply relevant options, like including the Tax Cuts and Jobs Act 2017 or excluding Medicare premiums.
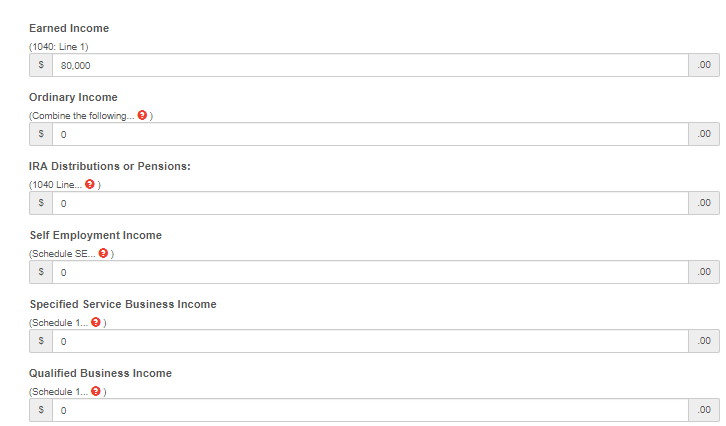
- Input information from the client's tax return into the software. You can enter their information under “Ordinary Income,” "Capital Gains," "Other Income," "Above the Line Deductions," or "Schedule A." Other Income includes Social Security and tax-free interest. Above the Line Deductions includes any other above the line deductions and IRA contributions. Schedule A includes medical and dental expenses, taxes paid, interest paid, gifts to charity, casualty and theft losses, and other itemized deductions.
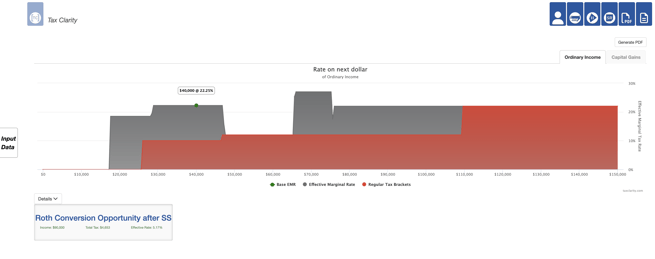
- Click "See Results" after entering your client's financial data. There is a "Details" button below the Tax Map. Click this button to see your inputs and calculated fields.
You can also create alternate strategies by going back into the input screen by clicking "Input Data," clicking on the plus sign, and selecting "Create a Blank Tax Map" or "Clone Current Tax Map." As you create strategies, you can click on this dropdown to switch between or delete strategies. You can also rename each strategy and see a side-by-side comparison view of each strategy that you create.
Tip: To print your report, select "Generate PDF" and click the printer icon at the top of the screen.
What information do I need to run a Tax Clarity report?
Your client's tax return should have the information you need to input into the software. Enter the information from the client's tax return into the software.
Tip: If a  appears above the respective input field, additional instructions are provided. Click the icon to see the instruction for each section and field.
You may need any or all of the following information from your client's tax return:
- Earned Income (Form 1040)
- Taxable Interest (Form 1040)
- Ordinary Dividends (Form 1040)
- Taxable Refunds (Form 1040)
- Alimony Received (Schedule 1)
- Unemployment Compensation (Schedule 1)
- Taxable Amount of IRA Distributions (Form 1040)
- Taxable Amount of Pensions or Annuities (Form 1040)
- Self-Employment Income (Schedule SE)
- Business Income (or loss) (Schedule C)
- Rental Real Estate, Royalties, Partnerships, S Corporations, Trusts, etc. (Schedule E)
- Farm Income (or loss) (Schedule F)
- Long Term Capital Gains (Schedule D)
- Short Term Capital Gains (Schedule D)
- Qualified Dividends (Form 1040)
- Gross Social Security Benefits (Form 1040)
- Tax-Free Interest (Schedule 1)
- Self-employed SEP, SIMPLE, and qualified plans (Schedule 1)
- IRA deduction (Schedule 1)
- Medical and Dental Expenses (Schedule A)
- Taxes You Paid (Schedule A)
- State and Local Taxes (Schedule A)
- Real Estate Taxes (Schedule A)
- Personal Property Taxes (Schedule A)
- Other Taxes (Schedule A)
- Interest You Paid (Schedule A)
- Home mortgage interest and points reported on Form 1098 (Schedule A)
- Home mortgage interest not reported on Form 1098 (Schedule A)
- Points not reported to you on Form 1098 (Schedule A)
- Investment interest (Schedule A)
- Gifts to Charity (Schedule A)
- Gifts by cash or check (Schedule A)
- Other than cash or check (Schedule A)
- Carryover from prior year (Schedule A)
- Casualty and theft Losses (Schedule A)
- Casualty and Theft Losses (Other Personal Casualty and Theft Loss) (Schedule A)
- Other Itemized Deductions (Schedule A)
How do I run a client report from Social Security Timing?
Tip: Simplify data entry using the Social Security Timing married intake form or single intake form.
To run a client report from Social Security Timing:
- Log in and select "Add Client."
- Choose "Import" or "Manual" data entry.
- Input client's marital status and name if using manual entry.
- Enter DOB and life expectancy, and click "Next."
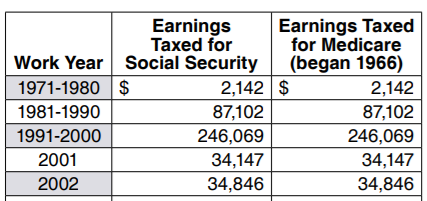
- Input Social Security earnings data: quick entry, specified entry, or historical earnings. When working with a married couple, you'll enter the data for each spouse.
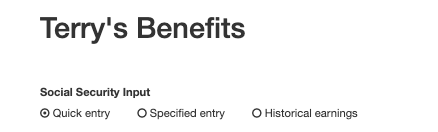
Tip: Obtaining the client's Social Security statement allows you to create a report using a benefit estimate, a specified election entry, or the historical data entry. The historical earnings give you the most accurate result as it allows you to strip out any assumptions that the Social Security Administration uses to generate their benefit estimates.
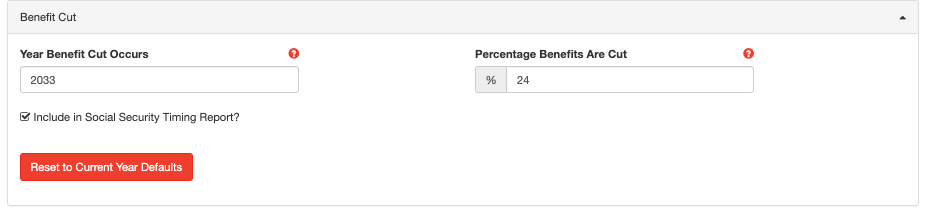
- Consider benefit cuts and additional incomes. Enter in a benefit cut start year, and the percentage of cuts. The default is based on the Social Security Administration's Trustees Report.
- Enter assumptions like inflation rate and discount rate. The inflation rate will act as your cost of living adjustment while projecting forward on other benefit formula calculations. The discount rate is used as present value of future value payments to compare strategies appropriately.
- Review and input client's income needs. Make sure to enter in the income need for your client as it allows you to illustrate the difference between what Social Security will provide and the client's income need. Social Security Timing can analyze the impacts of the Windfall Elimination Provision (WEP), Government Pension Offset (GPO), and the earnings test. Make sure to enter the client's non-covered pension and expected work history.
Note: You must enter in historical earnings in a non-covered pension in order to trigger the WEP and GPO calculations. It's only necessary to enter in the earned income to trigger the earnings test.
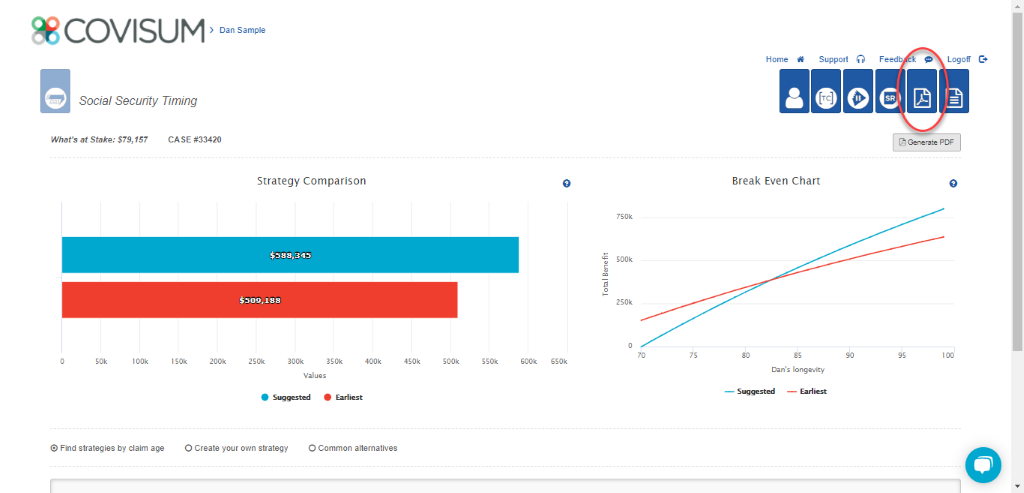
- Click the Social Security Timing tab in the upper right-hand corner.
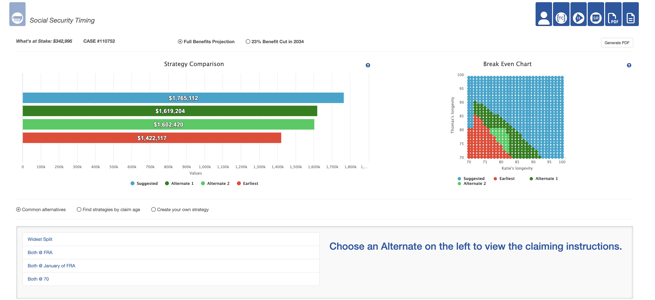
Strategy Comparison
This graph shows the present value of the suggested (blue) and earliest (red) claiming strategies, as well as up to two alternate strategies (dark green and light green). You can click on the bars to view the detailed strategy instructions, which outline when the client should file for benefits, what age they will start, and when they can get their first check.
Below the instructions, is an estimated versus desired income chart. This chart can help the client visualize the gap between their income need and what they'll get from Social Security. You can use this discussion an an opportunity to help transition to an overall retirement income distribution plan.
Scroll down to review the annual or monthly cash flows.
Breakeven Chart
This chart allows you to address your client's concerns about longevity by showing which strategy provides the best outcome at all life expectancy combinations.
- Create personalized strategies for comparison and analysis. You can create a custom strategy using common alternatives, find strategies by claiming age, or create a custom strategy. Selecting Common Alternatives and Widest Split allows you to have cash flows hitting the household right away while preserving the highest widow's benefit for the surviving spouse. If you want to add this to your report, select Make Alternate 1 or Make Alternate 2.
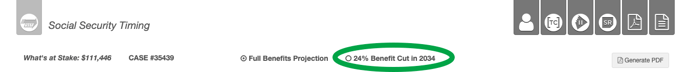
- Toggle between the strategies with full benefit payments and the benefit cut calculations as well.
Tip: To print your report, select "Generate PDF" and click the printer icon at the top of the screen.
Your Client's Social Security Statement
In 2021, the Social Security Administration changed the format of the Social Security statement to provide workers with the most pertinent information to help them make the best decision about when to file for their retirement benefit. The historical earnings are now listed page 2 of the statements and have been condensed, rather than page 3. Some of the earlier years have been combined or grouped together as an estimate for a period of years.
Note: Your client can only locate their entire earnings history by logging into their Social Security account. Once they're logged in, go to the section titled “Eligibility and Earnings,” and click “Review your full earnings record now.”
If you have any questions, please contact our customer experience team.
How do I run a client report from SmartRisk?
Tip: Have clients complete this intake form to make data entry quick and easy.
Getting Started
- Log in and select "Add Client."
- Select "Import" or "Manual Entry."
- Enter DOB and life expectancy, then proceed.
- Input all financial information. A red halo around a folder represents there is incomplete information within there and you will need to go and complete it.
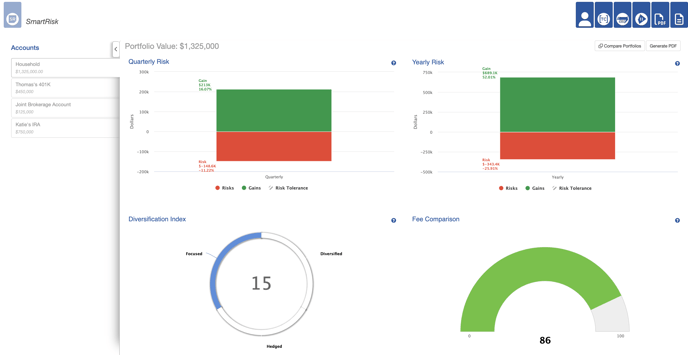
- Click the SmartRisk tab in the upper right-hand corner for a risk analysis.
- View Portfolio Value, Quarterly Risk, Yearly Risk, Diversification Index, and Fee Comparison reports.
- Click on Compare Portfolios at the top right to reallocate accounts and compare the risks between the base case and the plan case.
- The Accounts tab on the left-hand side allows you to switch between household and other accounts.
Tip: To print your report, select "Generate PDF" and click the printer icon at the top of the screen.
Create a PDF of Your Client Report:
- Log in to the portal.
- Add a client or select a client to view the client information page.
- Select the type of report you want.
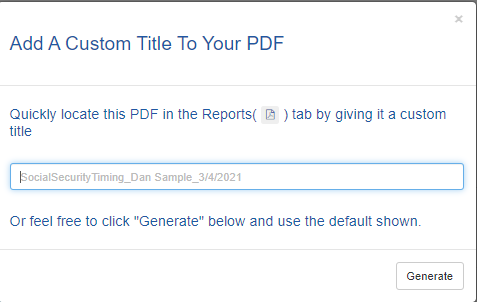
- Click the "Generate PDF" button in the upper right-hand corner. Each tool has a similar button placement. The example below is for Social Security Timing.

- Name your report and click the "Generate PDF" button. If you choose not to enter a name, Covisum will automatically name the report using the tool name, client name, and date it was generated. For example, SocialSecurityTiming_Dan Sample_3/4/2021.
- To access previously saved reports, click on the Adobe PDF tab in the upper right-hand corner of the screen.
- To print your report, select "Generate PDF" and click the printer icon at the top of the screen.