Video Transcription
Hi, I'm Dan with Covisum. Welcome to SmartRisk. Today, I'm going to show you a brief tutorial. I've uploaded a common case that one might expect to see when helping clients move into retirement.
As the wealth management world shifts further and further from the individual stock selection to a professionally designed asset allocation portfolio, the portfolio discussion shifts to a risk discussion rather than a conversation about the merits of each individual holding. You can effectively think of this shift as a shift in the discussion from portfolio construction to an ongoing discussion about how the portfolio fits into a plan. We'll demonstrate how SmartRisk helps you have a great risk discussion with your clients on an ongoing basis.
Before we get to the results, we're going to open up two folders, the accounts folder for John and the risk questionnaire. Over to the right-hand side, both John and Jane have multiple qualified, non-qualified and Roth accounts inside the accounts folder. You'll notice that John has two accounts, an IRA and a Roth. Each of John's accounts will be outlined with individual holdings. These individual holdings can be manually entered or added through our Redtail or TD integrations. The client info that is imported includes: names, DOB, account number, account description, and account balance. Now let's take a look at the risk questionnaire.
Risk Questionnaire
The risk questionnaire is intentionally designed to be simple and to compliment the "know your client" forms that you're probably already using. There's two key elements to the risk discussion. The first is what happens if the client has a bad quarter. The question you would ask your client is, "if you have a statement that has X amount of loss, what does it take before you'll give me a call and say, I need to go to cash." The point of having this conversation on the front end is to draw a guidepost and in a way you're able to better serve as the client's behavioral coach. The second question is, "in a bad year, how much loss could you tolerate?" And the idea here is to have a conversation with the client and also test the loss on the overall financial plan. Now we can run our analysis.
Heavy-Tailed Distribution
The important thing about the SmartRisk analysis, and what's different than most other risks softwares out there in the marketplace today, is that it's based on a heavy-tailed model. The heavy-tailed model means that our model does a better job at identifying the real risk in a client's portfolio. In other words, extreme market events happen far more often than the metrics that most of the risk software in the marketplace use. Most of them are based on a normal distribution or a bell curve. And we know that those extreme market events that happen relatively frequently are also much larger than the bell curve would predict. The heavy-tailed model that underlies SmartRisk captures those risk events that much better.
Charts and Graphs in SmartRisk
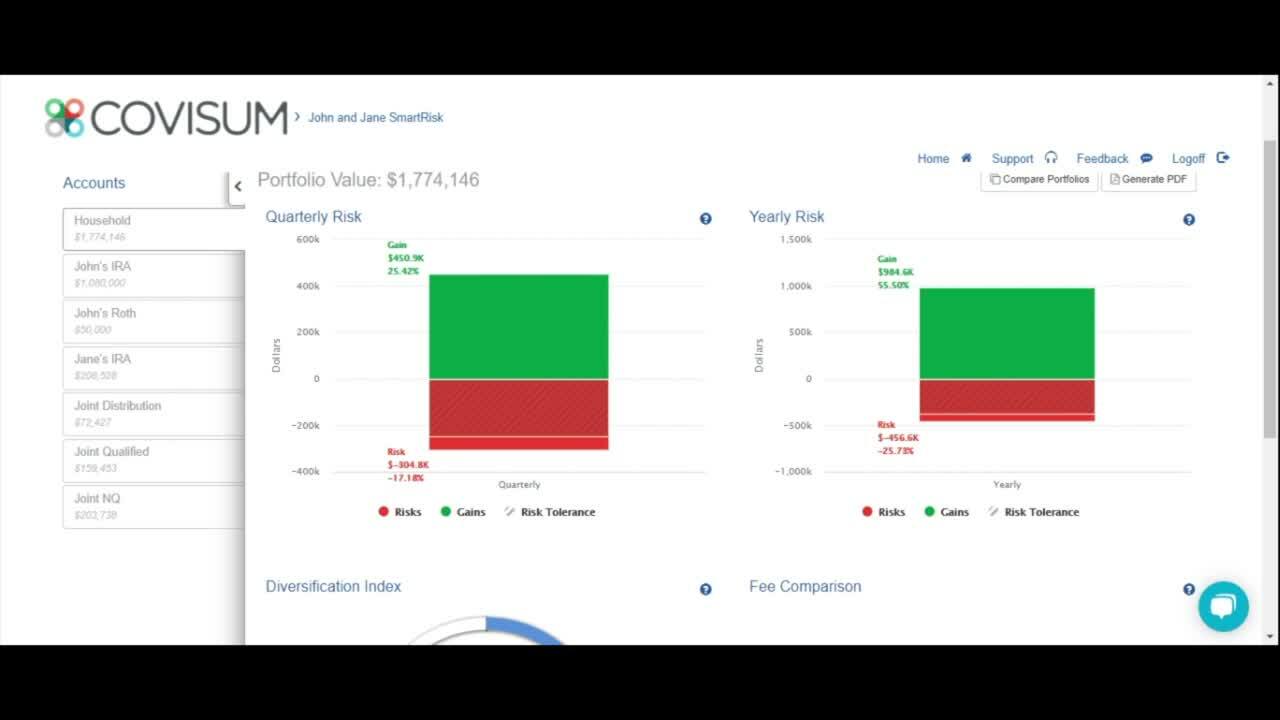
Now, there are a couple of key points here on the screen. If you look on the left-hand side, you'll see each of John and Jane's accounts and an aggregate risk profile at the household level. We're going to focus mostly on the client's household and yet each different account may be allocated differently.
Now let's look at the risk profile on a quarterly and annual basis. The gains are green. Risk is red, and the client's risk tolerance is the striped section, overlaying the risk. Being able to measure the risk in the portfolio and determine if we are close to the client's risk threshold and prepare the client for those inevitable risk events is what the quarterly risk number is about. Remember, the yearly risk number is all about the client's goal. If I take the 21% risk on an annual basis into the client's plan, and I apply that this year is the client still on track to reach their retirement goals? If they are, we know that we have the ability to get through this year and onto the next, if they're not, we're able to build a contingency plan in advance. Now the other two charts are important as well. The diversification index is all about identifying whether the holdings in a portfolio react to the same economic factors or not. In other words, is something likely to come out of left field and surprise me? In this case 17% of the client's risk is diversified away.
Fee Comparison Chart
And finally, you see the fee comparison. The fee comparison takes each holding in the client's portfolio and compares it to its peer group, and then aggregates it up to the portfolio level. So in this case, the fee efficiency of this portfolio is better than 91% of its peers out in the marketplace. I also have the ability to compare portfolios. And for this example, I'm going to use a saved comparison as I've preloaded how I want to reallocate my portfolio. I can either reallocate all accounts to one model, or I can reallocate to different models by account. I chose to reallocate all models based on the type of account they have–more conservative for the qualified accounts and more aggressive for the Roth.
Now, what you see is two portfolios side by side. So, in this case, the current portfolio is a little out of line with the client's risk tolerance. And the proposed portfolio is much closer. When we take a look at the annual risk, it's actually a little bit more conservative than the client indicated they would be comfortable with however we're much closer. And what we'll also notice is that we have a very similar long-term potential gain given that we have less risk.
Diversification Index
Now let's take a look at the diversification index. There's a much lower propensity to get surprised out of left field because the proposed portfolio is considerably more diversified than the current portfolio. Whenever you see a professionally designed portfolio, you're likely to see something in the range of 20% to 40% on the diversification index.
And finally, we scroll down to the fee comparison. We can see that their proposed portfolio is well into the green. So, it's actually more fee efficient than 87% of the other holdings that could have been used to construct the portfolio. This is very similar to the current portfolio.
The goal with these four metrics is to be able to equip you as the advisor, to have a conversation that keeps your client focused on the long-term.
If you have any questions, please feel free to reach out to our customer experience team.