When market volatility strikes, it is normal for investors to grow anxious about their holdings. But market swings and economic downturns are a normal part of investing. Trouble only starts to develop when investors make impulse decisions and overreact to these market swings.
Although it can seem counterintuitive to some investors, the best response to a stock market plunge is to sit tight, avoid drastic decisions, and patiently wait for the market to rebound. By sticking to a set investing strategy, they can wait out this market volatility and protect their holdings until markets stabilize and the economy recovers.
If you’re looking for some extra support to encourage clients to stick to their strategy, here are 15 charts and facts that will help keep their eyes on the long run.
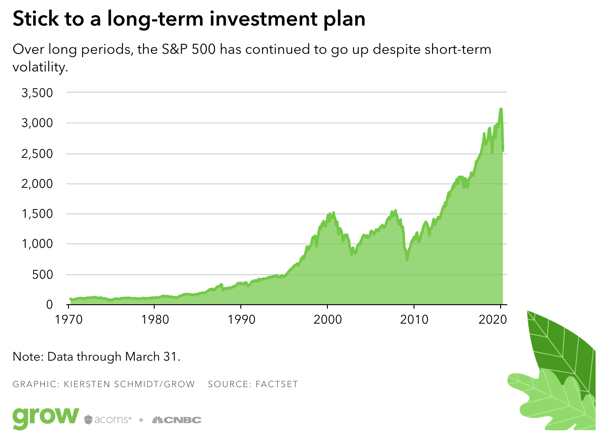
1. Even with recessions, the S&P 500 has risen by more than 2,700 percent since 1970.
Every market experiences volatility and short-term dips in value, but growth still wins out over time. As the chart below illustrates, economic recessions are just blips in a much larger overall trend toward long-term growth:
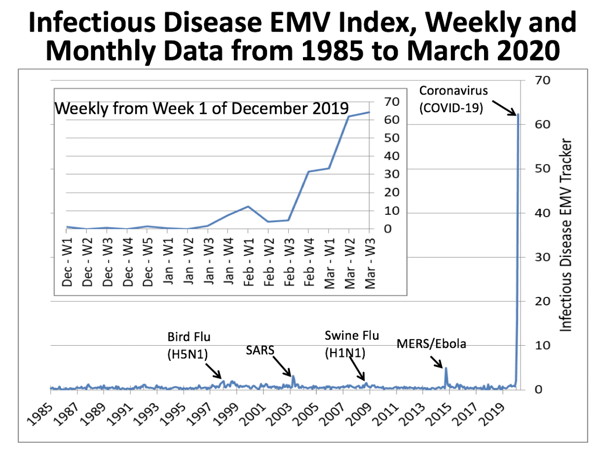
2. There’s little modern precedent for an infectious disease causing lasting damage to the stock market.
Although multiple infectious disease outbreaks have affected economic activity in recent years, a study of newspaper reporting shows that since 1985, these outbreaks have only had a marginal impact on the US stock market—which suggests that the long-term implications of COVID-19 might be overstated:
3. The S&P’s 28 percent decline is an investment opportunity, not a casualty.
If you have automatic contributions set up for your retirement accounts or are planning to make contributions to investment funds in the near future, you could avoid missing the opportunity cost of sizable profits as the market recovers.
4. Since 1986, only five calendar years have delivered a negative return on the S&P 500.
The recent losses in the stock market may be cause for concern. However, most calendar years see net growth in overall stock market value, which should be encouraging for long-term trading strategies.
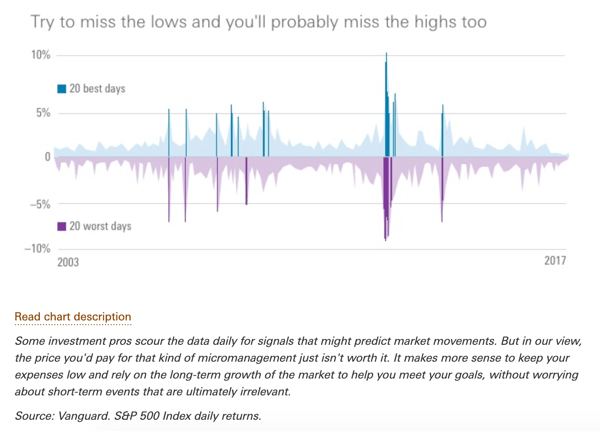
5. The market’s strongest-performing days often follow its worst days.
As the chart below illustrates, the stock market’s 20 worst-performing days since 2003 have often been closely followed by the 20 best days:
6. Over the past century, the average annual return on the stock market is about 10 percent.
Big losses are bound to happen, but the general trend for stock market values ultimately points upward.
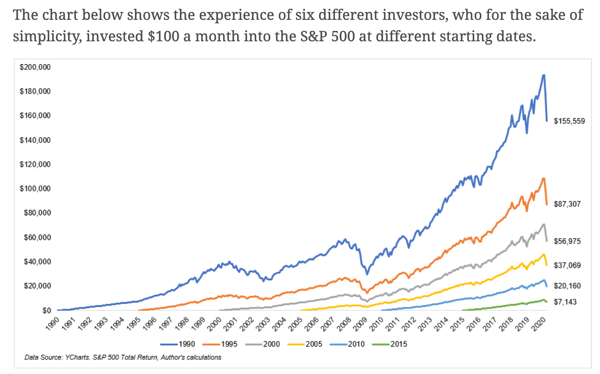
7. Timing the market is never a smart strategy. Instead, focus on getting in as early as possible.
As the chart below illustrates, timing your trades around bear markets doesn’t pay off as well as simply investing early and often:
8. In the 12 months after the end of a bear market, the average stock portfolio generates returns of 37.1 percent.
Here’s even more incentive to stick to your strategy and avoid selling off stocks: Investors who missed the first six months of that recovery and instead held onto cash until the upward trend was established only generated returns of 7.6 percent. Don’t give away your position just because the market is down.
9. In a bear market, Roth conversions can help you alleviate your tax burden.
The CARES Act has postponed minimum required distributions for investors, which has tax implications that can save you money if you decide to accelerate Roth IRA and Roth conversions during the bear market. Learn more about these tax-saving strategies in this video from our founder and president.
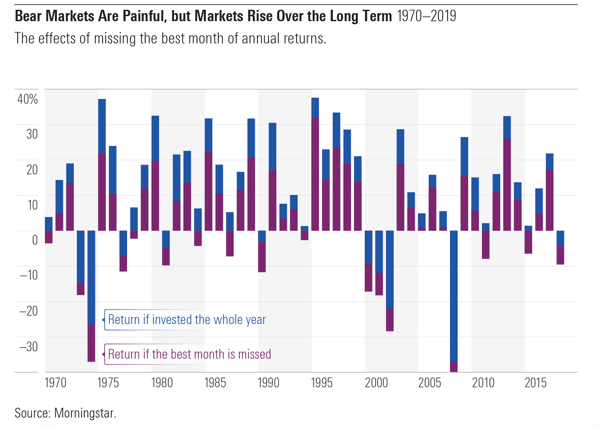
10. Missing the best month of recovery can kill your profits and long-term investment value.
As the chart below illustrates, investment returns take a serious hit when investors miss out on the best periods of growth—which is all the more reason to hold your position throughout the bear market:
11. Investors who held their S&P funds throughout the 2008-2009 bear market earned more than double the total return of investors who missed the first three months of recovery.
Compared to investors who missed the first month of recovery, those patient traders generated around a 40 percent better return. The implications of those lost returns will become even more obvious as the investments’ value continues to grow over time.
12. Even after a 10 percent market decline, the historical one-year return in value is over 11 percent.
Similar returns are also seen over the three-year and five-year average, underscoring the economic recovery and growth that follows recessions and market resets.
13. Of the 25 worst-performing months of the US stock market, the overall market value was higher one year later following 56 percent of those months.
Meanwhile, the value of the market was higher five years later after 80 percent of those historically bad months:
14. If investors missed the 10 best days of each decade of the S&P 500, their total return on their investments would be just 91 percent.
By comparison, an investor who kept their holdings steady would have generated a return of 14,962 percent. You can’t turn big profits unless you’re in position when those large swings happen.
15. Over the past three decades, fully diversified portfolios would have generated 82 percent of the return of a portfolio of large-cap stocks.
Investors averse to volatility should consider this: That same diversified portfolio would have presented only 64 percent of the volatility of the equity portfolio. Talk to your clients to determine whether diversification makes sense for their investment holdings.
Despite their name, extreme market events are far more common than many investors would expect—and more prevalent than traditional risk modeling often accounts for. Covisum’s SmartRisk software uses a heavy-tail model of distribution that helps investors account for these extreme market events, and build a strategy that can withstand their impact.
Learn more about the SmartRisk’s benefits by downloading our white paper: The Risk Evolution.

.svg)