Provide Retirement Insights and Add Bottom Line Dollars for Your Clients
Income InSight® was designed to help advisors visually answer their clients' biggest questions about retirement and quantify the value they deliver. One of the best ways our new retirement income planning platform executes this is with stress test icons. Let's take a closer look at the feature.
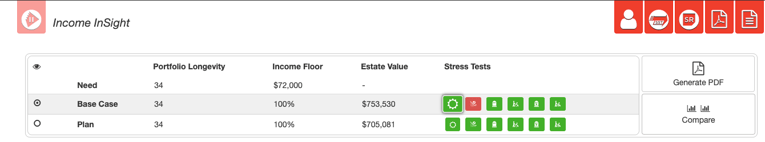
After you login to the portal and add a client and run their report, the top of the results screen will show three basic metrics:
- Portfolio Longevity — Will the client’s money last through retirement?
- Income Floor — How much of the client’s income need is met through guaranteed income sources?
- Estate Value — How much remains after tax for the people and causes the client cares about?
Immediately to the right of these figures are the stress test icons.
You can click the stress test icon to see the description of the stress test and how your clients will fare in each of the following situations. For our example case study, we used the following assumptions:
- John has $562,774 in qualified money, and his Social Security benefit amount is $2,500.
- Jane has $272,310 in qualified money, and her Social Security benefit is $1,500.
- They have $250,000 in their joint non-qualified accounts.
- Base needs are $6,000 per month.
- They have a moderate portfolio and it is valued at $1,135,638.
- COLA: 2.6%
- Discount Rate: 4%
- State Tax Rate: 0%
- Beneficiary Tax Rate: 25%
Everything is Fine
We assume that the economy stays stable, which is modeled across your accounts. This stress test applies the standard market assumptions across each account differently based on the growth model of the individual account.
Down Market
We assume that the economy experiences a recession, which is modeled across your accounts. We then assume a recovery period before going back to a normal return scenario. This stress test applies the down market assumptions across each account differently based on the growth model of the individual account.
John Dies Early
We assume that John dies at age 70 and 1 month. Jane’s monthly income need after John's death is $5,000.
John Needs Long-Term Care
We assume that John has a long-term care need at age 86. The additional monthly cost of care is $4,000, which inflates annually by 5 percent, and the need lasts for four years.
Jane Dies Early
We assume that Jane dies at age 70 and 1 month. John’s monthly income need after Jane's death is $5,000.
Jane Needs Long-Term Care
We assume that Jane has a long-term care need at age 91. The additional monthly cost of care is $4,000, which inflates annually by 5 percent, and the need lasts for four years.
What Do the Icons Mean?
The icons appear in green if the client’s money will last through a difficult financial situation. The down market icon is highlighted in red, because in the event of a down market, the portfolio does not last throughout retirement. If you click the red icon, you can see the exact moment that the down market starts to cause a problem. You can see here that the clients make it 27 years, and at that point only 36 percent of their income need is coming into the household, and of course that doesn't allow them to leave any money behind to the people or causes they care about. This is definitely an area of concern for these particular clients.
The stress test icons appear beside both the base case and the plan to show you a comparison between the two. When you click the down market icon by the base case, you see the exact moment the clients run out of money. When you click the down market icon by the plan, you see how the suggested plan fixes to correct the issue.
Sign up for a 10-day free trial of Income InSight and explore the stress tests and other cool software features to help with retirement income planning. Your free trial includes access to our expert support team who can answer any questions you may have.

.svg)