"Hidden Yardage"
Successful football coaches often rely on a simple statistical measure of performance known as “hidden yardage”. Simply put, it is the yardage provided by solid special teams play and execution that ultimately impacts field position. In statistical terms, if a team scores on special teams, historically they win over 70% of the time. If a team starts inside their own 20 yard line, they have a 12% chance of a touchdown. That percentage increases to 25% at the 50 yard line and so on. Clearly, hidden yardage offers an interesting metric for performance analysis and overall success. If you start every drive at midfield, it’s hard not to win.
With SmartRisk, “hidden yardage” can be found by investigating the underlying portfolio contents within the context of the SmartRisk assessment. Once a client’s risk tolerance and asset allocations are assessed, there can be opportunities for hidden yardage within the portfolio on a component level. By analyzing some of these portfolio dynamics, advisors can help manage clients towards a more optional field position.
A closer look at the Metrics in SmartRisk
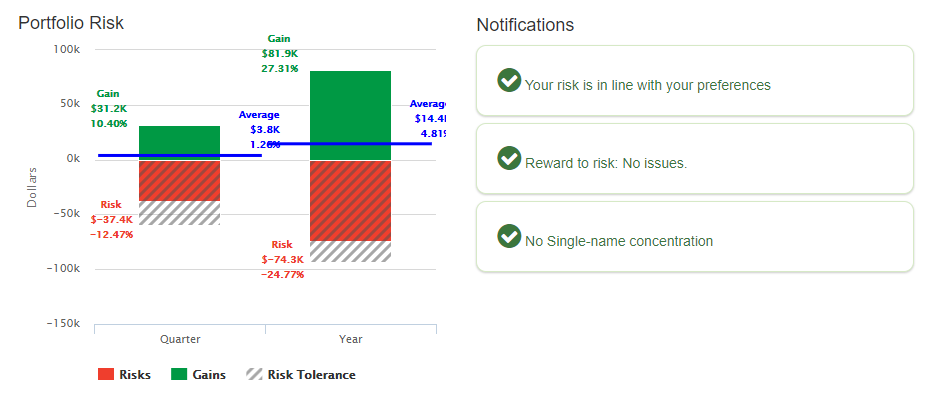
Portfolio Risk
This metric establishes a “stake in the ground” for portfolio risk. It would mark the worst case “field position” during a period of market stress. Remember, changes made in times of stress are the often the worst that can be made. It is impossible to call for a “fair catch” in the middle of a market rout. The risk questionnaire will help set those risk levels, by asking, “In a bad quarter or year, how much loss could you tolerate?” That question can be answered in either dollar or percentage terms in comparison to the approximate portfolio value in the portfolio risk graph.
The blue line in the graph highlights the average returns for the respective period, either on a quarterly or annual basis, calculated over a ten-year period. At first glance this figure may appear low, however you should note that this a Compound Annual Growth Rate (CAGR) rather than an arithmetic average.
The red bar with no lines is the actual downside risk—what does a bad quarter or year really look like? The gray shaded area is the loss the client indicated they were comfortable with in a down market. If the red bar is greater than the gray shaded area, the client would have a portfolio with calculated risk greater than indicated comfort levels.
Notifications will highlight situations where single name concentrations may exist, if reward to risk is out of balance or if the client’s current portfolio is out of balance with their risk tolerance.
Drawdown Analysis
This metric outlines the performance of the input portfolio against the major market downturn that occurred from early 2008 through March of 2009. While portfolio components and economic circumstances today are clearly different, the drawdown does provide a compelling argument for a thorough consideration of risk tolerance.
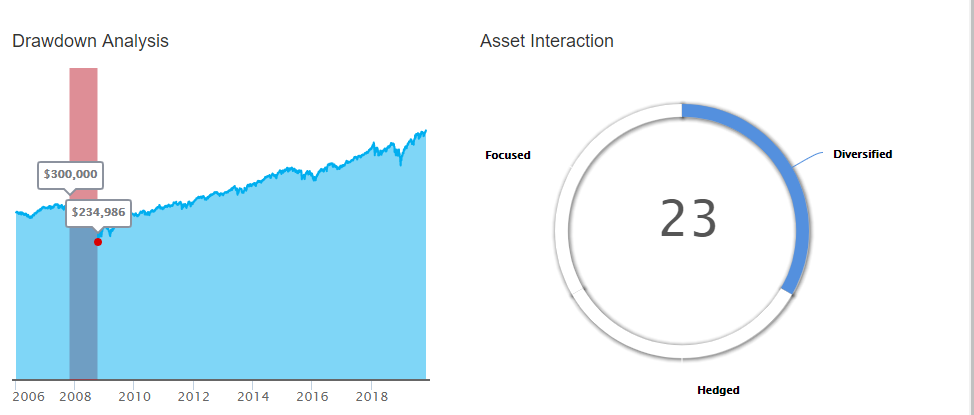
Asset Interaction
Completely unique to SmartRisk, the asset interaction metric describes the percentage of risk “diversified away” during times of stress. The asset interaction figure will designate portfolios as either focused, diversified or hedged, based on real risk measurements, rather than simple correlation matrices for a particular asset mix. Asset interaction calculations are designed to determine if, in times of market stress, the assets move together (focused), are reasonably offset (diversified) or are fully offset (hedged). These offsets can be good or bad depending on market expectations and conditions. For example, during a bull market, a focused portfolio in growth stocks is not a bad thing, while a perfectly hedged portfolio would leave some available returns on the table.
So, where is the hidden yardage?
By looking at the portfolio risk figure above, everything looks pretty good. On a clockwise basis, from the upper left with the portfolio risk graph, the client’s overall performance stayed within their risk preference, there are no notification points highlighted, the asset interaction chart is in the “focused” range and the drawdown analysis, while not pleasant, managed quite well looking at the unique period of 2008-early 2009.
Remember the portfolio as entered for this assessment, either manually or via a RedTail import, was largely a list of symbols and quantities, and there is a lot to be gathered when taking a deeper dive into those inputs with a scouting report.
Target Funds
A favorite of many investors and retirement plans, these are popular because of the automatic asset allocation adjustments. In most cases, target funds are designed to become more conservative as the target date approaches. It is wise, however, to reconsider these target dates at various intervals. Most investors chose funds with a long target date, usually an assumed retirement date. Those portfolios then follow an “equity glide path” to adjust portfolio asset balances. As investors approach their “decumulation period”, which itself could be 25 to 30 years, it may be wise to reconsider the target date. Oftentimes, maintaining a higher equity position in those years will provide the necessary growth for the health of the overall portfolio. Indeed, some funds now have “rising equity glide paths” which begin with a larger portion in bonds. The key is that a “target date” should be reconsidered over time to reflect changes in market conditions, tax considerations and overall retirement planning, including the decumulation period.
Fund of Funds
Many large fund companies offer these types of structures to investors to offer some diversification. They are also commonly used for target funds, and the issue can be the expenses involved. A “fund of funds” in and of itself may not have a high stated management fee, but that may not be the case for the underlying funds that define the portfolio. Management, performance and distribution fees can add up quickly given the fund of funds structure.
In 2007, the Securities and Exchange Commission created a line item for Acquired Fund Fees and Expenses (AFFE), which shows the operating expenses of the underlying funds in the respective prospectus and semi-annual reports. It is now a mandatory line item on the fund’s fee schedule. Minimizing those fees can have a dramatic impact over time given a range of anywhere from less than 1% to near 10% depending on the management agreements. This is especially true if the fund of funds agreement includes outside managers. Indeed, where cross-section situations exist, Carhart (1997) found that each percentage point increase in the expense ratio decreases returns by 1.5% per year on average.
Mutual Fund Share Classes
As a follow-on to the AFFE discussion, mutual fund symbols can quickly provide information about other underlying fees and sales charges. Interestingly, in March of 2019, the SEC settled charges against 79 investment advisors who will return more than $125 million to clients, with a majority of those funds going to retail investors. The issue was regarding the placement of investor assets in funds with 12(b)-1 fees, or in certain share classes, when lower cost options were available.
A quick glance at mutual fund symbols often provides clues regarding expenses. Retirement shares, those with an “R” in their five-digit symbol, are designed for retirement plans and are the least expensive. They should be part of any defined contribution plan. “T” shares began being implemented in June 2017 in response to the Department of Labor’s fiduciary rule in an attempt to level the field for sales charges across all mutual funds. Overall, mutual fund symbols within a portfolio should define the proper class agreed to and available to the client with the fiduciary rule as a consideration.
Another great example here is breakpoint pricing. In this instance, a client may have made a significant purchase in a fund, but the amount was not quite high enough for a “breakpoint” into a lower fee threshold. A right of accumulation within the fund may allow for a lower sales charge given a commitment to reach a certain asset level (often within 13 months), or a total asset level (within the entire fund family). These levels may have also been reached over time given reinvestments of dividends and capital gains. Ultimately, it is best to simply ask if a lower sales charge and fee structure is available.
Fund Overlap
In this instance, investors may have a good portion of their portfolio in different funds within one fund company. Some of fund names imply diversification, with or without deliberate attempts, with words like fundamental, blend, growth, contra, blue-chip and the like. Oftentimes, however, the largest portfolio holdings have a considerable overlap between them. For example, in the recent past, many of these funds have had significant concentrations in the FAANG stocks (Facebook, Amazon, Apple, Netflix and Google). On a fund level, these may have been 2% or less for each stock in the specific fund, but if the decision to use multiple funds was for diversification, it may not have accomplished the goal as desired. A survey of portfolio holdings at the fund level can show some of these overlapping positions and a proper judgement can be made. Pushed to the extreme here, is a management fee paid in one fund worth it if the fund is largely just piggy-backing on the research of another?
ETF Structures
Exchange traded funds (ETFs) have become a market behemoth over the past twenty years or so, and their proliferation has sparked a wide variety of interesting structures and investment objectives. YOLO (You Only Live Once), for example, is an exchange traded fund with just $45 million in net assets that is dedicated to the cannabis industry. While catchy, it probably isn’t a necessary holding in a serious retirement portfolio.
In another example, many investors simply look at investment returns over time when making purchase decisions. During a bull market, with a cursory glance, they may turn to an ETF with strong historic returns without realizing that it is highly leveraged. Leveraged funds utilize derivatives such as futures and swaps that magnify price swings. By design, they are often leveraged to realize two to three times the magnitude of a given market price move. They are not a conservative portfolio of equities, by any definition, despite titles that often include things like “S&P 500” in their name.
Stock Morphosis
Companies change, and those changes are not simply in value. Discreet or dramatic, the changes often result in an investment that is no longer appropriate given the investment intent within the portfolio. For example, Netflix was a low-cap start-up internet retailer, but they became part of the FAANG high-growth story. Today they are arguably no longer a “high growth” name given competition (content & price) in streaming. They are now more of a media content company and the stock should be valued as such. All these dynamic changes occurred in less than 10 years, but in the context of a long-term investor, is it still a suitable position given their risk/reward expectations for the future?
A more discreet example would be certain corporate spin-offs. On paper, equity owners of a parent company receive equity in a “spun off” company. While it may be related to separating core competencies, some of these events have been to get rid of unwanted legacy costs. To quote the National Retiree Legislative Network, a “strategic spin-off of under-performing units is a well-established tactic that holds even greater appeal when legacy pension, health and welfare benefits can be taken off the books of the parent company”.
In the case of the auto industry, major auto makers often spun off auto parts makers to get rid of legacy defined benefit liabilities. Many of those spin-offs were ultimately driven to bankruptcy. What appears on the surface as return on an investment with new shares in a “new” company may, in fact, be a red flag for that overall investment in the future, and it should be analyzed accordingly.
Another structural change to consider are stock splits. On paper, again, it looks like a good thing, with new shares being offered as “return” to the holder of a certain number of shares, say a 2 for 1 split. These are often done, however, to increase trading liquidity and market participation. In the instance of reverse splits, they may be used to hold the $1 per share requirement for listing on a given stock exchange. In the example of a “reverse/forward” split, they are used by companies to eliminate shareholders that hold fewer than a certain number of shares, largely for corporate governance purposes.
Cash Accumulation
Making sure assets are at work seems simple enough, yet it is often overlooked in timeframes that can be impactful. In today’s world, there are overtures of “moving into cash” and “putting cash on the sidelines”. While there is clearly a need for some cash in any portfolio, the timely reinvestment of cash where ever possible is critical to achieving hidden yardage returns. Proactively getting those funds to work does not allow for 3, 6, or 12 months to pass before an investment decision is made, and those are arguably significant investment time frames.
It is also key to remind investors that while cash is safe, it is not a diversification mechanism. It simply reduces the level of assets participating in the investment portfolio, and it certainly does not offer protection against inflation.
Asset Location
One final consideration here within the context of hidden yardage is the tax code, which can almost always be used in an advantageous manner. Here, it is not the allocation between equities and fixed income being considered, it is the location of those investments in qualified or non-qualified accounts within the portfolio. Hidden yardage, for example, may be gained by understanding a slight increase in the allocation of equities is available in a taxable account, all things being equal, given the location of those assets in that account when capital gains are taxed at a lower rate than ordinary income. Frequently, the cash distributions and accumulations mentioned above can be used over time to accomplish that goal without a major portfolio reconstruction. Roth conversions, when appropriate, can also take advantage of asset location opportunities.
Overall, each of these items can provide hidden yardage – a bit of solid special teams play to create an advantage within a client’s portfolio. Start your 10-day free trial of SmartRisk to find hidden yardage for your clients.

.svg)