By Ron Piccinini, PhD

This is inspired by a true story.
There was this fellow named Edmund. Edmund's high-priced education had taught him the virtues of portfolio diversification. His job as a banker paid him a nice sum of cash every month, plus bonus; he had bought a house, and his retirement account was comprised of a diversified mix of domestic and international stocks. On his office wall was hanging this quote from the Merchant of Venice: "My ventures are not in one bottom trusted, nor to one place; nor is my whole estate upon the fortune of this present year." To the annoying Head of Risk he used to explain: "The five-year correlation between real estate and stocks is seven percent. And the correlation between my monthly paycheck and the stock market is even lower. Low correlation, diversification!"
The year was 2008, and over the following 12 months, Edmund's home equity became negative. His diversified portfolio mix of domestic and international stocks lost half of its value. Finally, his employer, facing massive losses, was forced to lay off a large number of its employees, including Edmund. Without a job during the following nine months, Edmund cashed his retirement account to pay for his mortgage and monthly expenses. Back to the proverbial square zero, but worse.
The tale of Edmund is insightful when it comes to understanding diversification. Does diversification simply mean investing across a multitude of asset classes? We argue that effective portfolio diversification is achieved only when one single 'factor' cannot take down the entire portfolio. Investing in multiple asset classes is one possible method to achieve diversification, necessary, but not sufficient.
Asset interaction
Can diversification be assessed numerically? We present here a quick and simple way of estimating diversification:
From a risk management point of view, the holdings in a portfolio can exhibit different levels of diversification:
- If some securities in a portfolio "zig" when the others "zag," then they offset each other's risk. This is the most usual case.
- If securities in a portfolio change in value such as to exactly offset each other's movements, then the portfolio is perfectly hedged.
- If securities move exactly in lockstep, then no diversification occurs, and the portfolio acts as one security.
To measure this phenomenon, we introduce the asset interaction index, calculated as:

Where "Risk" is the 99.5% Expected Tail Loss (ETL); sometimes also known as Conditional Value-at-Risk (VaR), or Expected Shortfall, it is obtained by taking the weighted average between the VaR and losses exceeding the VaR.
A simple example
To arrive at a working indicator of diversification, let's compare the following two portfolios, holdings and return time series:
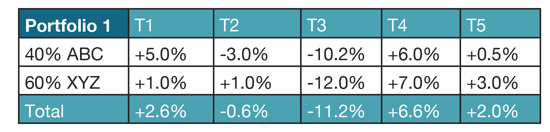
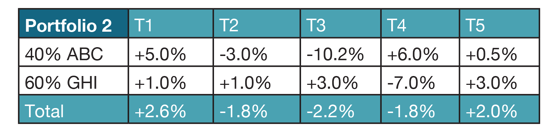
Portfolio 1 is made of a 40% investment in asset ABC, and a 60% asset in XYZ. The historical returns of this portfolio are represented in columns T1 to T5. Upon inspection of the returns during time periods T3 and T4, we note that the assets in Portfolio 1 tend to have their worst returns at the same time (T3), as well as having their best returns also at the same time (T4). This stands in contrast with Portfolio 2, where no such tendency is detected. While both Portfolio 1 and 2 have the same weighting and same number of assets, it is easy to agree, at least intuitively, that Portfolio 2 is more diversified than Portfolio 1.
This simple example illustrates two points. Firstly, the number of assets and/or their weights in a portfolio is not necessarily reflective of portfolio diversification. Secondly, what matters seems to be the co-movement of the assets during times of extreme variation. When comparing these portfolios we did not look at what happened during normal times, we looked at what happened when the underlying assets had their largest movements. This is the crux of understanding diversification: what happens to a portfolio when one of the constituents experiences a large change in value? Assessing diversification has very little to do with the number of asset classes in a portfolio, or statistical correlations. A portfolio could be comprised of hundreds of stocks with low correlations during quiet times, and indeed offer low to no diversification.
Numerical example
1. Assume a portfolio comprised of the following positions:
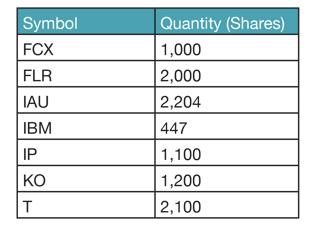
On February 27, 2015, the one-day ETL at the 99.50% confidence interval of this portfolio was estimated to be:

2. Now, let's assume that the one-day individual securities' ETL at the 99.5% confidence interval are as such:
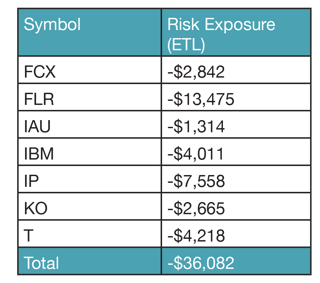
From the table above, we have:

3. The portfolio asset interaction index is therefore:

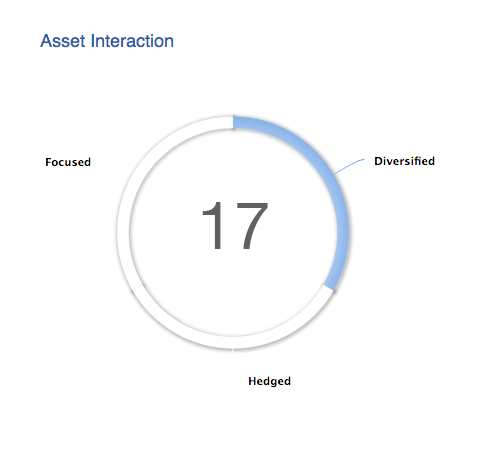
While the portfolio is comprised of many securities, they are (only) absorbing about 16.7% of the risk away.
Scale and interpretation of the asset interaction index
- A reading of zero means that everything in the portfolio moves exactly together (i.e. no diversification).
- A reading of 0 to 16 means that assets in the portfolio have a tendency to move together. The portfolio is focused.
- A reading between 16 and 60 means that the portfolio is somewhat diversified.
- A reading of 60 to 100 is hedged.
- A reading of 100 means that the portfolio is perfectly hedged (i.e. price movements do not affect the value of the portfolio).
In conclusion
When talking about portfolio diversification, it is customary to talk about the number of assets and/or their correlations. The tale of Edmund, and the simple example shown before, demonstrate that these concepts are not sufficient to assess diversification. We showed you what happens to the overall portfolio when underlying components are experiencing extreme changes in values, and that measures of co-movement during quiet/normal times are unfortunately of little value. In this regard, we proposed a simple indicator of diversification, using the ratio of a portfolio's ETL to the sum of the ETL of its underlying components. This way of thinking can be expanded by using stress scenarios where ETL cannot be readily estimated by standard methods. If a single factor can take down an entire portfolio, the portfolio in question cannot be said to be diversified.
Looking for an easy way to get these reports for your clients? Try SmartRisk for free for 10 days.

.svg)