Asset interaction. Drawdown analysis. Reward/risk ratio. Know the terms that will help you wow clients with SmartRisk™.
 SmartRisk™ doesn’t just deliver better risk estimation for your clients’ portfolios. It delivers it in a way that is easy for both you and your client to understand.
Learning just a few terms used in the software and its easy-to-read reports will help you interpret the calculations and explain them to clients — not just so they understand, but so they understand in a context that truly resonates with them, influencing their behavior.
SmartRisk is a powerful technology that helps you better estimate a client’s portfolio risk so that they can avoid behavioral mistakes that can hurt them financially. Take a few steps now to learn the lingo that will help you use the software to its full potential — and ultimately, to wow your clients with results.
Asset Interaction
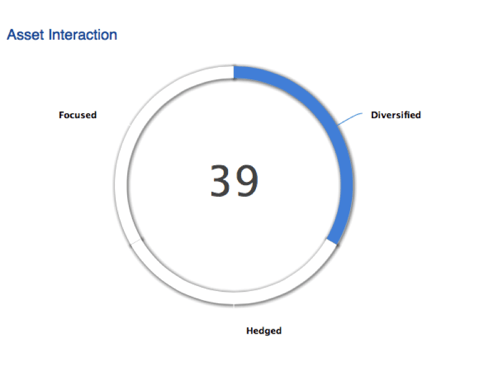
Quick Definition: A measure of the individual assets in the portfolio interact in terms of risk. The number represents the percentage of idiosyncratic risk eliminated through diversification.
Diversification is achieved when the gains in certain holdings of your portfolio offset the losses of other holdings. It means that you don’t have all (or most) of your eggs in the same basket. Diversification is critical because it reduces the impact of (bad) luck and isolated events on the overall performance of your portfolio.
How to use it: More diversification is not necessarily good or bad. Portfolios with a low asset allocation index (i.e. AI < 16) will be highly dependent on the performance of one single economic factor, and thus are deemed to be ‘Focused.’ Finally, portfolios with very high levels of internal hedging (i.e. AI > 59) are deemed to be 'hedged' and may in certain cases find it difficult to appreciate in value, as most of the gains made by some of the portfolios’ components could be offset in large parts by losses in other parts of the portfolios.
Read more about SmartRisk's asset interaction calculation.
Drawdown Analysis
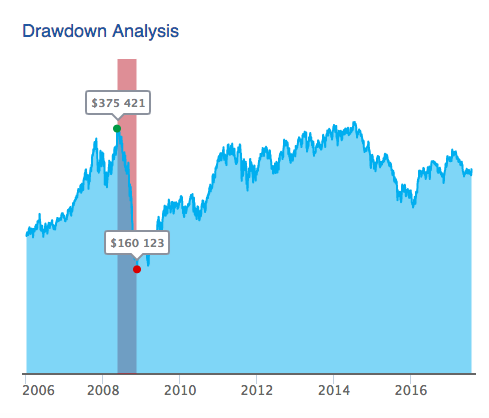
This chart depicts the theoretical evolution through time of the value of the portfolio assuming the following:
- The current value of the portfolio is invested right before the worst peak-to-through since January 2006
- The portfolio shares (not weights) are held constant throughout. The number of shares are based on the current shares in the portfolio.
- The chart shows the value of the portfolio after the worst drawdown
- No fees, taxes or re-balancing costs are included in the calculation of this equity line.
Reward-to-Risk Ratio
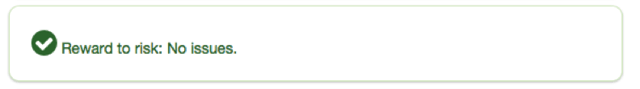
Quick Definition: The Reward-to-Risk Ratio answers the question "Am I compensated for the risk taken?" It is the ratio of a portfolio’s Expected Gain to its Expected Loss. The term ‘expected’ refers to its statistical definition. Loosely speaking:
- A ratio above 1.00 means that average gains of the portfolio are larger than average losses.
- A ratio below 1.00 means that average losses in the portfolio are greater than the average gains.
How to use it: In the event that a portfolio has a Reward-to-risk less than 1.02, the system generates a low reward-to-risk alert
Learn More
Example: Why playing American Roulette is a losing strategy, using the Reward-to-Risk ratio: Assume we place a $10 bet on Red
Expected Gain = P(Red) x $10 + P(Not Red) x $0
= 18/38 x $10 + 20/38 x $0 = $4.737
Expected Loss = P(Red) x $0 + P(Not Red) x $10
= 18/38 x $0 + 20/38 x $10 = $5.263
Reward-to-Risk Ratio = Expected Gain ÷ Expected Loss
= 4.737 ÷ 5.263 = 0.900
For every dollar lost, we’d receive 90 cents back, on average.
Portfolio Risk
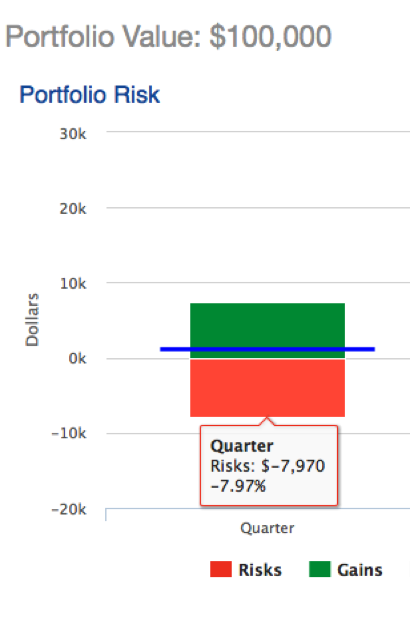
Quick Definition: Portfolio risk is an estimate of the downside of the portfolio over the quarter in dollars and as a percentage of the total value of the portfolio.
How to use it: Risk is neither good nor bad in a vacuum. The appropriate amount of risk depends on many factors, such as the client’s ability to sustain losses (both financially and psychologically), as well as his/her risk tolerance. This number can also be used to set proper downside expectations with your clients.
A Few Benchmarks (Quarterly Risk):
|
Equities (SPY) |
Bonds (AGG) |
75% Equities / 25% Bonds |
50% Equities / 50% Bonds |
25% Equities / 75% Bonds |
|
-24% |
-7% |
-19% |
-13% |
-8% |
Learn More: Total Risk is calculated using the Expected Tail Loss at the 99.5% Confidence level using SmartRisk GLOVE distribution models. The “Expected Tail Loss at 99.5% level” is the expected return on the portfolio in the worst 0.5% of the cases. It is a measure of the average 0.5% worst losses of a portfolio over a specified period of time. For example a quaretrly ETL_99.5% of $21,458 is to be interpreted as such: “the average loss of this portfolio, assuming a worse than 1-in-200 quarter scenario, is $21,458.” The ETL of a portfolio is not the max loss of the portfolio. It measures the magnitude of the average bad scenario.
See all these tools in action and get a 10-day free trial of SmartRisk.

.svg)