An Opportunity for a SmartRiskTM Assessment
October has taken its lumps over the years with recurring discussions of the “October effect.” Perceptions, based on significant events like the “Black Monday” sessions in 1929 and 1987, have led investors to believe that historically, October tends toward negative returns more so than other months of the year. Statistically, over the long term, the October effect has not held true, indicating the bias is a largely a psychological one, but it remains a common moniker within the market, nonetheless.
Looking quickly at October 2019, that psychological overhang was clearly in the market and the press, but major indices hit new highs with relatively modest market volatility despite trade war concerns, “unicorn” IPO underperformance, softening manufacturing data, increasing farmer bankruptcies, freight and rail traffic contractions, record gold prices, impeachment proceedings and an election looming in 2020. So where was the “expected” swoon?
The expectation of a market decline provides a great opportunity for advisors to start a discussion with clients and align risk tolerance.
Returns Versus Volatility
Overall, while October market returns have not been shown to consistently underperform other months on a historical basis, October market volatility levels have historically been higher than other months. That is a very significant distinction for overall risk assessments with your clients. Given the psychological impact, right or wrong, associated with the October effect, the true negative correlation of volatility to stock prices is clear, and it indicates there is a benefit to a discussion of volatility, and risk comfort levels, with your clients.
Expectation of Volatility
The following chart of the CBOE Volatility Index (VIX) provides a nice visual for discussion. In simple terms, the CBOE Volatility Index is a measure of the market’s expectation of volatility implied by S&P 500 Index options. Some refer to it as a “fear gauge” due to the previously mentioned negative correlation between volatility and performance. Note that the VIX was first developed by the CBOE in 1993, thus historic data here does not cover periods prior to 1990. In this chart, dating back to the financial crisis, the VIX hit record highs, and it also rose significantly in October 2011 during the European debt crisis. More recently, there were significant spikes in August 2015 and December of 2018 during down markets, but it is noted that these moves, while high in percentage terms, were fairly modest in nominal terms.
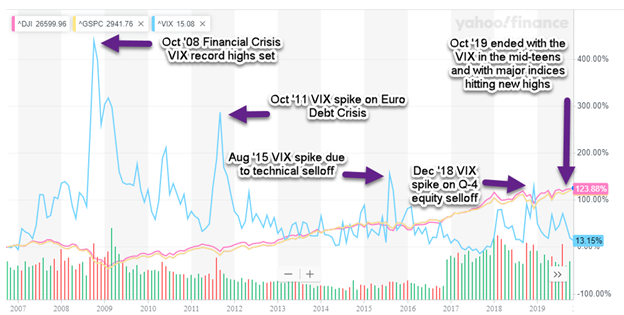
Generally, many market participants consider a VIX level above 25 to describe a market with high price volatility. Moves above 20, however, often create a “keep an eye on it” feeling in the marketplace. It should be noted that the very nature of the VIX calculation can exacerbate price moves in the volatility index. Because it is based on prices of S&P 500 options, as volatility itself increases, the calculation can include a lot of “wing options” (those at the very high and low ends of the spectrum). Those wing options probably wouldn’t have been traded if it weren’t for actual volatility along with the expectation of additional volatility.
So, where do we stand? Looking forward to 2020, expectations of market volatility and significant downside risk remain firmly in place despite recent “all is well” market movements. Indeed, late October activity at the Chicago Board Options Exchange (CBOE) included very significant volume in the April 2020 65 calls, thus some are looking for protection against the VIX moving significantly closer to the 65 level before April 2020 (and for the first time since the Financial Crisis of 2008-2009). Hence, there are expectations of an associated market decline.
Add Value With SmartRisk
SmartRisk software provides advisors with the computational strength for more relevant estimations of risk and, therefore, answers to your clients’ biggest questions like, “Is my portfolio more (or less) risky than I think?” and “Is my portfolio really diversified?
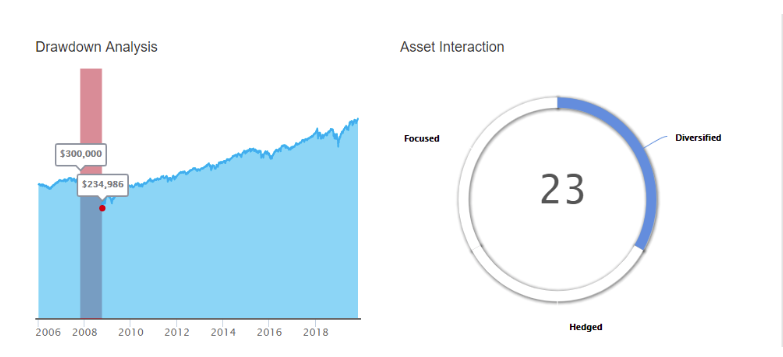
Historically, models of investment risk relied on a normal distribution, also referred to as a ‘bell curve.’ A reasonable downside risk estimate for a portfolio was defined as something that happens in the “tails” of the bell curve—a bad event was something that should only happen 25 times in 1,000 years.
SmartRisk uses a heavy-tailed model to provide more precise portfolio risk measurement, because the actual risk of big losses in client portfolios is much greater than the standard deviation calculation would suggest. SmartRisk doesn’t show what we think will happen; it’s what could happen. This more realistic estimate of risk allows advisors to assess a client’s overall risk situation and have a conversation with the client in advance of the next downturn and set reasonable expectations, which may be beneficial going into the New Year.
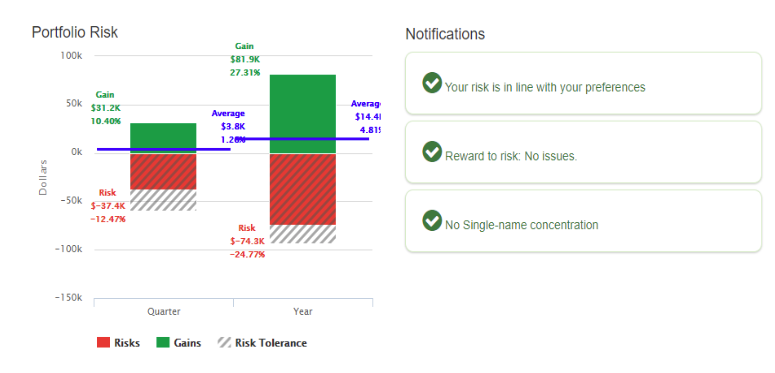
According to a survey completed by Business Insider, only 27% of people with an advisor have had a discussion about their downside exposure is in a significant downturn. Based on your client’s current investment portfolio data (you can import the data from RedTail) SmartRisk allows you set proper downside expectations and start a discussion about risk in terms your clients understand—dollars. The software also offers:
- Portfolio comparisons
- Single name concentration alerts
- A “household” view of accounts
- Marketing materials, including a field-tested risk seminar
Use the expectation of a market decline to start conversations with your clients about their behavior and their risk tolerance and potentially add unforeseen value to their retirement strategy.

.svg)